Origin of Sporadic E
Steve Reed, G0AEV
Issue 57 Six News, May 1998
AB4YK suggests that sporadic E is due to terrestrial interaction with cometary debris and bases his theory on interpretations of the data recorded at 88 MHz Es by Pocock and Dyer (published in QST in March 1992). The key to his argument is that recorded Es openings are date specific, which if true leads to the logical inference that there must be an astronomical cause for sporadic E. Unfortunately his critical assumption that the Es activity/date relationships can not be due to chance alone is false and the cometary origin of Es theory can not be sustained. I do not expect readers to take my word for this so I shall demonstrate how purely random data can produce the ‘date specific’ peaks shown in graphs of the Pocock and Dyer data. First there is some circumstantial evidence that is worth looking at that should ring some alarm bells.
The theory states that sporadic E probabilities occur on specific dates year after year, just as the major meteor showers do. So let’s look at some real data and see how well this fits with the theory. The Six and Ten Reporting Club is a good source for 50 MHz data for the UK and is based on the observations of many well respected 50 MHz operators. In the June 1997 Six and Ten Report the probable best days for Es in June were noted as the 3rd and 18th. June 18th is one of the peak days for Es in the Pocock and Dyer data, so perhaps the AB4YK theory is right? June 21st is a poor day in both datasets - case proved perhaps? But 6 & 10 data also shows 10th as the best July day, yet this is a below average day in the Pocock and Dyer data. We need to compare the data over many days in order to test the reliability of the theory.
| Pocock nd Dyer |
Six & Ten | Six & Ten | Six & Ten | Six & Ten | Six & Ten | Six & Ten |
| 1993 | 1994 | 1995 | 1996 | 1997 | ||
| 18 June | GOOD | POOR (6) | GOOD (23) | GOOD (21) | BAD (4) | GOOD (30) |
| 21 June | BAD | FAIR (17) | BAD (4) | GOOD (22) | MOD (10) | BAD (5) |
| 1 July | BAD | MOD (13) | MOD (10) | GOOD (26) | FAIR (18) | POOR (6) |
| 8 July | GOOD | GOOD (28) | BAD (4) | FAIR (16) | POOR (7) | BAD (2) |
| 15 July | BAD | POOR (9) | GOOD (28) | GOOD (20) | BAD (2) | FAIR (18) |
| 17 July | GOOD | MOD (15) | FAIR (18) | BAD (5) | POOR (7) | GOOD (24) |
| 26 July | GOOD | MOD (11) | BAD (1) | BAD (0) | MOD (10) | MOD (14) |
At the top of page 28 is a table listing notably good or bad days for Es as identified in the Spokes article with comparable data for the last five years from the Six and Ten Report. In brackets are the 6 & 10 ‘areas’ counts – a measure of the geographical extent of Es events. Some of the good-bad days correlate with the Pocock-Dyer data, but equally often they don’t. This is the pattern of chance, as a detailed comparison of the two datasets would show. I suggest you try your own records for fits.
This lack of correspondence can be seen between other similar sets of Es data. For example, a graph of observations made by G4IGO of sporadic E at 144 MHz collected over 21 years (printed in the Six and Ten Report, May 1996) is identical in style to that of the Pocock and Dyer data. This graph shows obvious peaks and troughs interpreted as good and bad days for Es, but these occur on different dates to those in the Pocock and Dyer data.
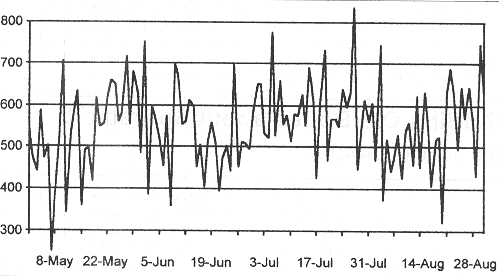
 Fig 1. The result of using random
numbers to stimulate the monthly incidence of Sporadic E
More circumstantial evidence comes from sources such as the DX packet cluster. How often do ‘good’ days coincide in different parts of the world (in the same hemisphere, of course)? Although I have not collected enough data to prove the point, Es openings in North America and Europe frequently do not occur on the same days, as should be the case if the causative agent is cometary.
I think it is possible to show statistically that the Pocock and Dyer pattern of good and bad days could be due to chance alone. A simple but convincing method of demonstrating this is to use a random number generator such as the toss of a coin, or, more conveniently, a computer random number generator. The graph in figure 1 was produced by:
generating a random number between 0 and 100 (these are arbitrary units) for each date in the months of May, June, July and August,
repeating this process 11 times for each of 11 years, and
summing the numbers for each date over the 11 years.
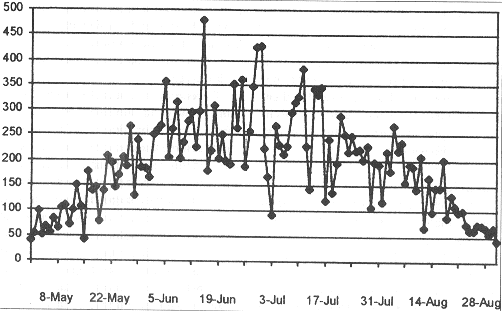
Each run of the random number generating program produces similar charts with peaks and troughs in the fashion of the Pocock-Dyer graph, but the peaks and troughs appear randomly on different days. Obviously the graph is simplistic as it ignores the seasonal Es distribution (peaking in mid-summer). This can be mimicked by superimposing the data on a sine curve, a purely cosmetic improvement that has no effect on the statistical nature of the argument. More importantly the simple model above also assumes an equal chance of any random number occurring. In real life Es measurements (areas counts or times of openings) are not linear. Perhaps only at 28 MHz does Es occur on nearly every summer day: at 88 and 144 MHz there are many days when no Es is recorded. The higher the frequency the more non-linear the distribution, the greater the chance of low numbers or zeros, and the more spiky the resulting graphs. This is easy to model in the computer, and figure 2 shows an example of a graph produced with higher probabilities of low or zero counts superimposed on a sine curve.
 Fig 2. A seasonalised version of the
random simulation of the monthly incidence of Sporadic E
The important thing to remember is that all the data used to make the
example graphs are random. It is exactly this random nature of sporadic-E that produces
the graphs used to illustrate AB4YK’s theory. Each year will deliver a unique pattern
of Es events which when summed over a number of years will produce some exaggerated peaks
and troughs. There is no need to invoke any other explanation.
The conclusion I draw is that the day-to-day positions of peaks and troughs in the Pocock and Dyer data are entirely due to chance, and that the idea that Es events have a particular timing is a myth. This is not to say that cometary debris or meteors do not have some effects on sporadic-E or contribute to the data, but that this contribution is likely to be small. Sporadic-E is complex and its origin can not easily be ascribed to a single process. The only celestial body that can be considered a prime cause of Es (and shows real relationships with Es distribution) is the Sun.